Sage: Open Source Mathematics Software
Sage has released version 5.6
Showing posts with label Sage. Show all posts
Showing posts with label Sage. Show all posts
Friday, January 25, 2013

Tuesday, January 15, 2013
Sunday, December 30, 2012
Tuesday, July 31, 2012
Friday, July 13, 2012
Sage Interact Database | Interact with the Sage community
Sage Interact Database | Interact with the Sage community
Wow, this looks pretty cool and sounds like an awesome idea. This is something Mathematica-esque.
Wow, this looks pretty cool and sounds like an awesome idea. This is something Mathematica-esque.
It is my pleasure to introduce the Sage Interact website at
interact.sagemath.org
It's a space for Sage users to share snippets of code or Sage worksheets
on a single, public site. Anyone can browse the published content, but
only registered users can access the full features. Register an account
by clicking on an OpenID account provider and confirming your email
address. Once you've registered, you can share your own snippets of
code, bookmark your favorite posts, and interact with other users.
Sage 5.1 - Download for Linux - Ubuntu PPA
Sage - Download for Linux
I just realized that Sage 5.1 is out. I think I was on 4.7 something on my desktop at home!
Anyways, they now have a ppa for Ubuntu users. I may have known this, but since I haven't used Sage in awhile I may have forgotten. I am mainly using Python now. I will still occasionally use Sage and wxMaxima for backup and to keep up with its development.
apt-add-repository -y ppa:aims/sagemath
apt-get update
apt-get install sagemath-upstream-binary
I just realized that Sage 5.1 is out. I think I was on 4.7 something on my desktop at home!
Anyways, they now have a ppa for Ubuntu users. I may have known this, but since I haven't used Sage in awhile I may have forgotten. I am mainly using Python now. I will still occasionally use Sage and wxMaxima for backup and to keep up with its development.
apt-add-repository -y ppa:aims/sagemath
apt-get update
apt-get install sagemath-upstream-binary
Monday, April 16, 2012
Contour plotting (2D) - Sage - Streamlines
So, I am getting more familiar with other scientific software to use for my research. One I've been trying is Sage, and I've made a few post about it. I like it so far. Here is an example of a contour plot I've done recently for some streamlines and some effects.
http://www.sagemath.org/doc/reference/sage/plot/contour_plot.html


http://www.sagemath.org/doc/reference/sage/plot/contour_plot.html
kap_pa = 0.00621
r,z = var('r,z')
psee1 = kap_pa*z*sin(pi*r^2)
contour_plot(psee1, (r, 0, 1), (z, 0, 1), contours = 20, fill=False, axes_labels=['r','z'], aspect_ratio=1)

kap_pa = 0.00621
r,z = var('r,z')
psee1 = kap_pa*z*sin(pi*r^2)
contour_plot(psee1, (r, 0, 1), (z, 0, 2), contours = 20, fill=False, axes_labels=['r','z'], aspect_ratio=2)

kap_pa = 0.00621
r,z = var('r,z')
psee1 = kap_pa*z*sin(pi*r^2)
contour_plot(psee1, (r, 0, 1), (z, 0, 1), contours = 20, fill=True, axes_labels=['r','z'])

kap_pa = 0.00621
r,z = var('r,z')
psee1 = kap_pa*z*sin(pi*r^2)
contour_plot(psee1, (r, 0, 1), (z, 0, 2), contours = 20, fill=True, axes_labels=['r','z'], aspect_ratio=2)

kap_pa = 0.00311
r,z = var('r,z')
psee1 = kap_pa*z*sin(pi*r^2)
contour_plot(psee1, (r, 0, 1), (z, 0, 2), contours = 20, fill=True, axes_labels=['r','z'], aspect_ratio=2)

kap_pa = 0.00311
r,z = var('r,z')
psee1 = kap_pa*z*sin(pi*r^2)
contour_plot(psee1, (r, 0, 1), (z, 0, 1), contours = 20, fill=False, linestyles='dashdot', axes_labels=['r','z'])

kap_pa = 0.00621
r,z = var('r,z')
psee1 = kap_pa*z*sin(pi*r^2)
contour_plot(psee1, (r, 0, 1), (z, 0, 1), contours = 20, fill=False, linewidths=[1,5], linestyles=['solid','dashed'], axes_labels=['r','z'])

kap_pa = 0.00621
r,z = var('r,z')
psee1 = kap_pa*z*sin(pi*r^2)
contour_plot(psee1, (r, 0, 1), (z, 0, 1), contours = 20, cmap='hsv', axes_labels=['r','z'])

kap_pa = 0.00621
r,z = var('r,z')
psee1 = kap_pa*z*sin(pi*r^2)
contour_plot(psee1, (r, 0, 1), (z, 0, 1), contours = 20, cmap=[(1,0,0), (0,1,0), (0,0,1)], axes_labels=['r','z'])

kap_pa = 0.00621
r,z = var('r,z')
psee1 = kap_pa*z*sin(pi*r^2)
contour_plot(psee1, (r, 0, 1), (z, 0, 1), contours = 20, cmap='hsv', labels=True, axes_labels=['r','z'])

kap_pa = 0.00621
r,z = var('r,z')
psee1 = kap_pa*z*sin(pi*r^2)
contour_plot(psee1, (r, 0, 1), (z, 0, 1), contours = 20, cmap='hsv', labels=True, label_fmt="%1.4f", label_colors='black', axes_labels=['r','z'])

kap_pa = 0.00621
r,z = var('r,z')
psee1 = kap_pa*z*sin(pi*r^2)
contour_plot(psee1, (r, 0, 1), (z, 0, 1), contours = 20, cmap='hsv', labels=True, label_fmt="%1.4f", label_colors='black', label_fontsize=14, axes_labels=['r','z'])

kap_pa = 0.00621
r,z = var('r,z')
psee1 = kap_pa*z*sin(pi*r^2)
contour_plot(psee1, (r, 0, 1), (z, 0, 1), contours = 20, cmap='hsv', colorbar=True, labels=True, label_fmt="%1.4f", label_colors='black', label_fontsize=10, axes_labels=['r','z'])

Friday, February 10, 2012
Sage ImportError: No module named _md5 - Ubuntu 11.10
Ok, so I installed a fresh copy of Ubuntu 11.10 on a few Windows machines at school and downloaded Sage 4.8 to use. However, I was getting the error:
ImportError: No module named _md5
when trying to run Sage. The fix for this is to install the package:
libssl0.9.8
by either executing in the terminal the command:
sudo apt-get install libssl0.9.8
or installing it from the USC.
http://ubuntuforums.org/showthread.php?t=1863653
http://groups.google.com/group/sage-support/browse_thread/thread/c1cb916b28b0992e?pli=1
ImportError: No module named _md5
when trying to run Sage. The fix for this is to install the package:
libssl0.9.8
by either executing in the terminal the command:
sudo apt-get install libssl0.9.8
or installing it from the USC.
http://ubuntuforums.org/showthread.php?t=1863653
http://groups.google.com/group/sage-support/browse_thread/thread/c1cb916b28b0992e?pli=1
Thursday, February 2, 2012
mlab — matplotlib.mlab
mlab — Matplotlib v1.1.0 documentation
Numerical python functions written for compatability with MATLAB commands with the same names.
Tuesday, January 31, 2012
Sage - 2D plot - simple plot, more than one function on the same plot, axes limits, change color of function in graph
There are many options when plotting in Sage. Here is a simple example.
In Sage, the variable x is automatically known/defined. I then create a simple function similar to how I created alpha and f. I next equal p to the plot since I wanted to change the y axis range manually which you can do through the show command (or this can also be done in the plot command as well).

Here is another example of a 2D plot. This one shows how to plot a couple of functions.


alpha = 30*pi/180
show(alpha)
show(float(alpha))
f = (arcsin(alpha))^2 + log(tan(alpha/2)) - arcsin(alpha)*arctan(alpha)
show(f)
show(float(f))
g = (1/(0.7*sin(x)))*sqrt(1 + ((pi)^(-2))*((0.7*sin(x))^2)*(f - csc(x)*tan(x/2) - log(tan(x/2))))
p = plot(g, (0, alpha))
show(p, ymin = 0, ymax = 20)
In Sage, the variable x is automatically known/defined. I then create a simple function similar to how I created alpha and f. I next equal p to the plot since I wanted to change the y axis range manually which you can do through the show command (or this can also be done in the plot command as well).

Here is another example of a 2D plot. This one shows how to plot a couple of functions.
alpha = 30*pi/180
show(alpha)
show(float(alpha))
z = 0.5
r_max = z*tan(alpha)
show(r_max)
show(float(r_max))
lamb_da = (csc(alpha))^2 - (cot(alpha))*(csc(alpha)) + log(tan(alpha/2))
show(float(lamb_da))
cig_ma_c = 1
r = var('r')

psee = (1/2*pi)*(cig_ma_c)*(r^2)*(lamb_da + (z/r)*sqrt(1 + (z/r)^2) - log(sqrt(1 + (z/r)^2) - z/r) - 1 - (z/r)^2)

lamb_da_bi = (csc(alpha))^2 - (cot(alpha))*(csc(alpha)) + log(tan(alpha)/2)

show(float(lamb_da_bi))

psee_bi = (1/2*pi)*(cig_ma_c)*(r^2)*(lamb_da_bi + (z/r)*sqrt(1 + (z/r)^2) - log(r/(2*z)) - 1 - (z/r)^2)

p1 = plot(psee, (r, 0, r_max))

p2 = plot(psee_bi, (r, 0, r_max), color ='green')

show(p1 + p2)


Sage - displaying a float decimal point
In Sage, like many other mathematics software, uses either a float command or you can simply put a "." in your value to display decimals.
Screenshot:


f = (arcsin(alpha))^2 + log(tan(alpha/2)) - arcsin(alpha)*arctan(alpha)
show(f)
show(float(f))
Screenshot:


Monday, January 30, 2012
Sage - Declaring a value
So first things first. I simply want to declare a value for something. In this case I want alpha to equal some number.
Hit evaluate and it gives: (1/6)*pi It works!

alpha = 30*pi/180

show(alpha)
Hit evaluate and it gives: (1/6)*pi It works!

Installing Sage for Windows 7
This is a pretty cool mathematical program/software which is kind of like a combination of MATLAB/Octave, Mathematica, Maple, Maxima, etc. They even say that as a description. I've mentioned Sage before, but now I am going to really give it a go. To install for Windows 7 simply go here http://wiki.sagemath.org/SageAppliance and follow the instructions. First you will need to DL and install VirtualBox, though, here https://www.virtualbox.org/wiki/Downloads and DL the Windows Sage appliance here http://www.sagemath.org/download-windows.html.
Here are my earlier posts about Sage:
http://timothyandrewbarber.blogspot.com/2011/08/sage-open-source-mathematics-software.html
http://timothyandrewbarber.blogspot.com/2011/08/pre-built-binary-install-sage.html <-- Ubuntu install
http://timothyandrewbarber.blogspot.com/2011/08/sage-in-emacs-and-tex.html
Wednesday, August 24, 2011
Sage in Emacs and TeX
CTAN directory: /macros/latex/contrib/sagetex - http://www.ctan.org/tex-archive/macros/latex/contrib/sagetex/
sage-mode - http://wiki.sagemath.org/sage-mode
This is the SageTeX package. It allows you to embed code, results of
computations, and plots from the Sage mathematics software suite
(http://sagemath.org) into LaTeX documents.
====================================================================
The recommended way to acquire and install SageTeX is by installing the
Sage spkg; visit http://sagemath.org/packages/optional/, find the
current version number, and run "sage -i sagetex-[version]" in a
terminal. Then you'll need to make the file sagetex.sty known to TeX;
that file will be in SAGE_ROOT/local/share/texmf/tex/generic/sagetex,
along with documentation and examples.
If you can't or don't want to install SageTeX by using Sage, you can use
this CTAN package. If sagetex.py and sagetex.sty haven't been extracted
from the .dtx file, you'll need to do:
0. Run `latex sagetexpackage.ins'
If a PDF file of the documentation wasn't included with this
distribution of SageTeX, you will need to build the documentation
yourself. To do that:
1. Run `latex sagetexpackage.dtx'
2. Run `sage sagetexpackage.sage'
3. Run the indexing commands that the .ins file told you about.
4. Run `latex sagetexpackage.dtx' again.
You can skip step 3 if you don't care about the index. You will need the
pgf and tikz packages installed to typeset the figures.
The file example.tex has, as you likely guessed, a bunch of examples
showing you how this package works. You can compile it using a another
latex-sage-latex cycle as in steps 1-2-4 above. Note that example.tex
includes some PNG graphics which latex cannot use; to see those, use
pdflatex instead of regular latex or enable the imagemagick option. (See
the documentation.)
To use the SageTeX package with your own documents, see the
"Installation" section of the documentation.
SageTeX now includes `remote-sagetex.py', a plain Python script that
allows you to use a remote Sage server instead of a local Sage
installation, so now you can use SageTeX on any computer with TeX and
Python 2.6 installed.
This work builds on a lot of work by others; see the "Credits" section
of the documentation for credits. The source code may be modified and
distributed under the terms of the GPL, v2 or later; the documentation
may be modified and distributed under a Creative Commons Attribution -
Noncommercial - Share Alike 3.0 License. See the "Copying and licenses"
section of the documentation.
Please let me know if you find any bugs or have any ideas for
improvement!
- Dan Drake
sage-mode - http://wiki.sagemath.org/sage-mode
Description
sage-mode provides Emacs Lisp that helps you use Sage in GNU Emacs.
Warning! This is alpha code. This might fail horribly and is not (yet) easily customizable!
Pre-built Binary Install and Compile from Source Install — Sage Installation Guide v4.7.1
Pre-built Binary Install — Sage Installation Guide v4.7.1 - http://www.sagemath.org/doc/installation/binary.html
In order to install a binary (a pre-compiled version) of Sage:
1) Go here -> Download for Linux - http://www.sagemath.org/download-linux.html
and choose a mirror.

2) Choose you system bit type then system appropriate file -> my case was 64-bit and I chose the smaller file to download


3) Then extract package and move to desired folder location. For additional path naming etc. information see -> Pre-built Binary Install - http://www.sagemath.org/doc/installation/binary.html
I, for example, simply extracted it into the folder it was downloaded to -> home/Downloads then moved it to home.


4) Then simply execute the Sage command by typing:
in the directory. If you don't and try to double click on it like the big dummy I am then it won't run and you might get confused and try to run make (like I did) which is not necessary, but you can do it :). Sage will then open in a browser, but on your local machine. Sage is heavy on being online based (works in a web browser) so that is why it opens in a browser.


Also see link:
Quick Download and Installation Guide - http://wiki.sagemath.org/DownloadAndInstallationGuide
If you choose to compile yourself,
1) then download the source file from the mirror of your choice:

2) You may have to do extra steps (see below), but then run the command "make" without quotations (simply type make) in a terminal command line IN the directory where the "sage" file is located.

Source Code - http://www.sagemath.org/download-source.html
In order to install a binary (a pre-compiled version) of Sage:
1) Go here -> Download for Linux - http://www.sagemath.org/download-linux.html
and choose a mirror.
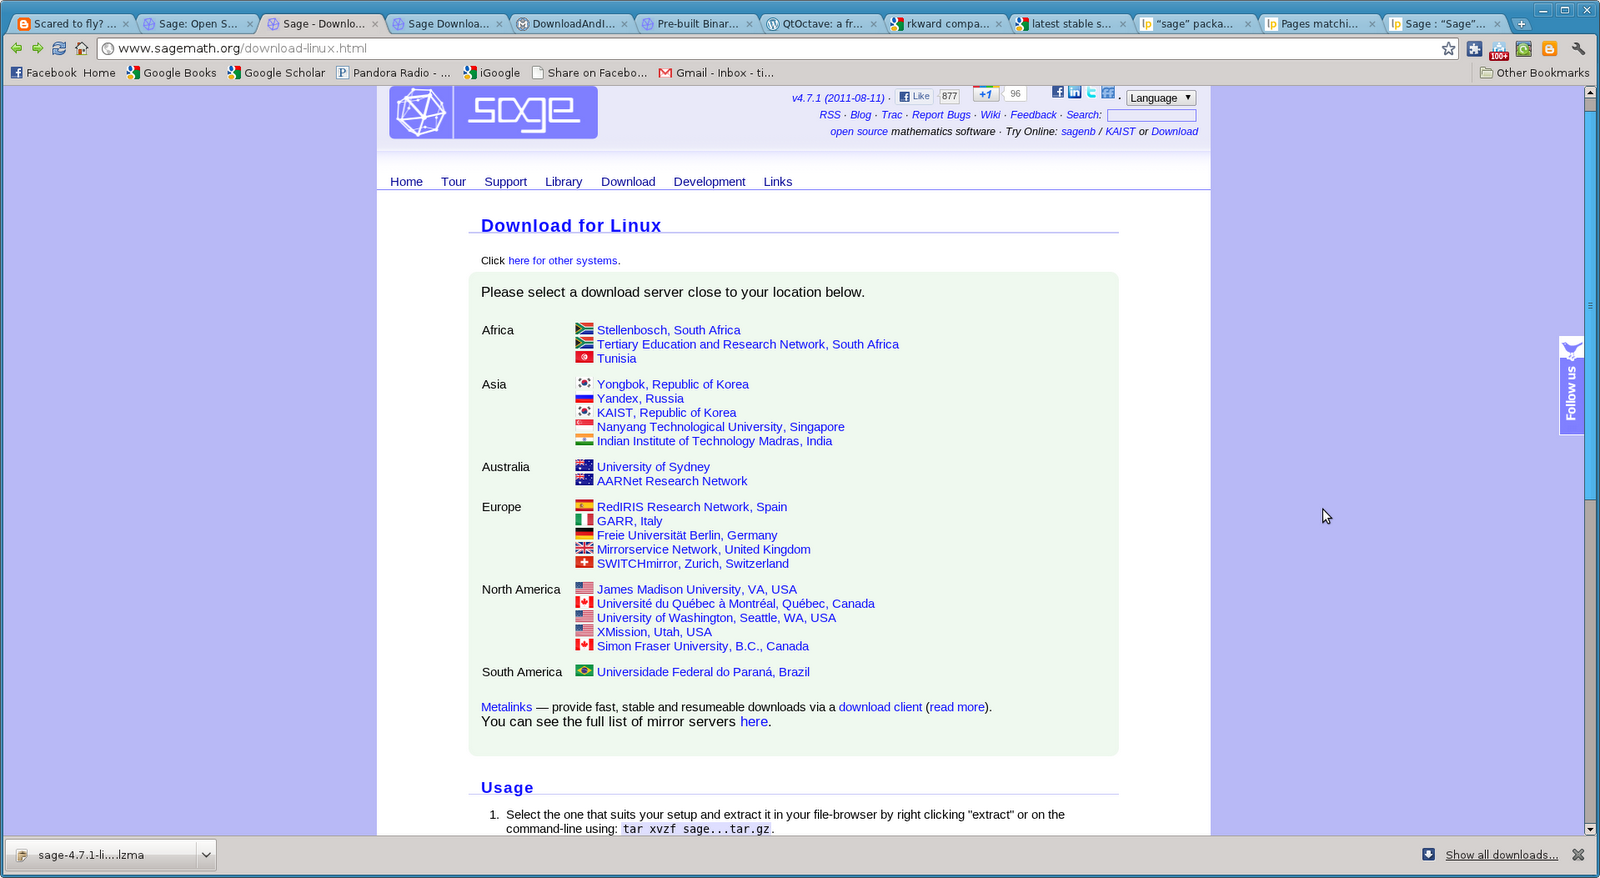
2) Choose you system bit type then system appropriate file -> my case was 64-bit and I chose the smaller file to download
sage-4.7.1-linux-64bit-ubuntu_10.04.1_lts-x86_64-Linux.tar.lzma
*.lzma compressed binaries can be extracted via
tar --lzma -xvf sage-*...tar.lzma
They save you about 150MB to download.


3) Then extract package and move to desired folder location. For additional path naming etc. information see -> Pre-built Binary Install - http://www.sagemath.org/doc/installation/binary.html
I, for example, simply extracted it into the folder it was downloaded to -> home/Downloads then moved it to home.


4) Then simply execute the Sage command by typing:
./sage
in the directory. If you don't and try to double click on it like the big dummy I am then it won't run and you might get confused and try to run make (like I did) which is not necessary, but you can do it :). Sage will then open in a browser, but on your local machine. Sage is heavy on being online based (works in a web browser) so that is why it opens in a browser.


Also see link:
Quick Download and Installation Guide - http://wiki.sagemath.org/DownloadAndInstallationGuide
If you choose to compile yourself,
1) then download the source file from the mirror of your choice:

2) You may have to do extra steps (see below), but then run the command "make" without quotations (simply type make) in a terminal command line IN the directory where the "sage" file is located.

Source Code - http://www.sagemath.org/download-source.html
Information
Thank you for your interest in Sage! You can get the complete source for Sage to compile it on your own Linux or Mac OS X system. Sage lives in an isolated directory and does not interfere with your surrounding system. It ships together with everything necessary to develop Sage, the source code, all its dependencies and the complete changelog.
Short instructions:
Extract archive
Start compiling:make
Run Sage: ./sage
Upgrade to newer version later:./sage -upgrade
Please read the README.txt and the installation guide for more details. Note: On Linux systems like Debian/Ubuntu, you may have to install the build essential package, the m4 macro processor, and gfortran:
sudo apt-get install build-essential
sudo apt-get install m4
sudo apt-get install gfortran
You might also consider installing the readline package and its corresponding development headers. These packages make it easier to work with the Sage command line interface by providing text editing features at the command line level:
sudo apt-get install readline-common
sudo apt-get install libreadline-dev
There is a very high level changelog.
You can browse all the tracked source code repositories and see exactly what's going on, and who did what when.
Monday, August 22, 2011
Sage: Open Source Mathematics Software
Once I get the hang of Maxima I think I will give this a go again. This can call software such as Maxima, Octave, etc.
Sage: Open Source Mathematics Software

Link to introductory videos on Sage and Python from the Sage website:
Screencasts and Videos - http://sagemath.org/help-video.html
Link to help and documentation from the Sage site:
http://sagemath.org/help.html
Sage: Open Source Mathematics Software

Sage is a free open-source mathematics software system licensed under the GPL. It combines the power of many existing open-source packages into a common Python-based interface.
Mission: Creating a viable free open source alternative to Magma, Maple, Mathematica and Matlab
Link to introductory videos on Sage and Python from the Sage website:
Screencasts and Videos - http://sagemath.org/help-video.html
Link to help and documentation from the Sage site:
http://sagemath.org/help.html
Subscribe to:
Posts (Atom)