
Showing posts with label Spyder. Show all posts
Showing posts with label Spyder. Show all posts
Tuesday, September 18, 2012
Commenting in Python
To comment in Python simply use the pound sign, #, in front of what ever it is you would like to comment. For Spyder users, the shortcut to this in the editor is Crtl+1.


Saturday, June 9, 2012
Getting Python to work in Windows - Python 2.7.2, Python(x, y) 2.7.2.3, Sypder2, and Mayavi2
Ok, whew, I finally got a good grasp on installing Python in Windows 7. I had it installed first (through Python(x,y) also apparently) but was having issues with getting Mayavi to work (or so I thought then, could have been ok I just didn't understand the structure until I got it to work now; not sure if I really understand, but whatever, it works).
So, I decided to uninstall everything again, and then re-install because I really had forgotten how I did it in the first place. After some googling and browsing, I knew I wanted to use and install Spyder because I had it before. So I went to the site http://packages.python.org/spyder/installation.html then found a link to https://code.google.com/p/spyderlib/. However, I kept seeing Windows - Python(x,y). So read and browsed a little more to find that Python(x,y) is a one stop for all source. It not only installs Python, Spyder, IPython, and libraries such as Numpy, Scipy, Matplotlib, etc., but it also installs many other packages such as the IDLE simple IDE/editor, Mayavi2, etc. (all are options of course). Python(x, y) also is integrated with or as (I don't yet understand) a Qt framework (again, not so sure what Qt is/does; like Java app development maybe?).
Qt links:
http://qt.nokia.com/
http://qt.nokia.com/products
Here is a nice schematic displaying the integration of Python(x, y) from http://code.google.com/p/pythonxy/wiki/Welcome

Python(x, y) home page link: http://code.google.com/p/pythonxy/
Python(x, y) installer download page: http://code.google.com/p/pythonxy/wiki/Downloads
The latest Python(x, y) version is 2.7.2.3 and simply download and run the installer .exe file: Python(x,y)-2.7.2.3.exe

I kept everything default under the installation except I added the SymPy library/package under the Python expansion.


Important note! The Mayavi website says to make sure ETS (short for Enthought Software?) is checked for the installation of Mayavi.
http://docs.enthought.com/mayavi/mayavi/installation.html
Python(x, y) installs with it Python 2.7.2

Although, there have been releases of Python 3.x (3.2.3 as the latest stable) and a more recent 2.7.x as 2.7.3. It seems that packages aren't caught up to 3.x yet, so it may be best to use 2.7.x for now? See these links for more:
http://www.python.org/
http://www.python.org/download/releases/2.7.3/
http://wiki.python.org/moin/Python2orPython3
After installation, I feel more comfortable and confident that Python and packages such as Mayavi are installed properly. I was getting an error before that Mayavi couldn't be found.
This is proof!
 Spyder is installed too.

So, I decided to uninstall everything again, and then re-install because I really had forgotten how I did it in the first place. After some googling and browsing, I knew I wanted to use and install Spyder because I had it before. So I went to the site http://packages.python.org/spyder/installation.html then found a link to https://code.google.com/p/spyderlib/. However, I kept seeing Windows - Python(x,y). So read and browsed a little more to find that Python(x,y) is a one stop for all source. It not only installs Python, Spyder, IPython, and libraries such as Numpy, Scipy, Matplotlib, etc., but it also installs many other packages such as the IDLE simple IDE/editor, Mayavi2, etc. (all are options of course). Python(x, y) also is integrated with or as (I don't yet understand) a Qt framework (again, not so sure what Qt is/does; like Java app development maybe?).
Qt links:
http://qt.nokia.com/
http://qt.nokia.com/products
Here is a nice schematic displaying the integration of Python(x, y) from http://code.google.com/p/pythonxy/wiki/Welcome

Python(x, y) home page link: http://code.google.com/p/pythonxy/
Python(x, y) installer download page: http://code.google.com/p/pythonxy/wiki/Downloads
The latest Python(x, y) version is 2.7.2.3 and simply download and run the installer .exe file: Python(x,y)-2.7.2.3.exe

I kept everything default under the installation except I added the SymPy library/package under the Python expansion.


Notice all the packages that come with Python(x, y):


Important note! The Mayavi website says to make sure ETS (short for Enthought Software?) is checked for the installation of Mayavi.
http://docs.enthought.com/mayavi/mayavi/installation.html
Python(x, y) installs with it Python 2.7.2

Although, there have been releases of Python 3.x (3.2.3 as the latest stable) and a more recent 2.7.x as 2.7.3. It seems that packages aren't caught up to 3.x yet, so it may be best to use 2.7.x for now? See these links for more:
http://www.python.org/
http://www.python.org/download/releases/2.7.3/
http://wiki.python.org/moin/Python2orPython3
After installation, I feel more comfortable and confident that Python and packages such as Mayavi are installed properly. I was getting an error before that Mayavi couldn't be found.
This is proof!


Wednesday, April 18, 2012
Python - 2d plot - matplotlib
Woohoo! I did my first plot in Python!! I am trying out Python because it seems to offer many utilities I can use in one place for various scientific research capabilities. In Ubuntu 11.10 I have installed the Spyder IDE and a few libraries such as scipy, numpy, matplotlib, and mayavi. Eventually, I want to plot 3-D streamlines which is where mayavi comes into to play, thus I need to learn Python. Plus, Sage can also use Python which I plan to experiment with later.
I am still very green to Python although I do have some programming experience (mainly MATLAB and a C class I took about 9 years ago, :P!!). For example, I've seen a few ways how to load these libraries:
or
From here I found this nice quote: http://old.nabble.com/pylab-td24910613.html
http://johnstachurski.net/lectures/more_numpy.html
Another explanation I found: http://code.activestate.com/lists/python-tutor/87392/
Anyways, I would recommend reading on the structure of python here http://docs.python.org/contents.html which is what I plan on doing.
On to the plot.
The code:
The figure:
Screenshot of Spyder IDE:

I am still very green to Python although I do have some programming experience (mainly MATLAB and a C class I took about 9 years ago, :P!!). For example, I've seen a few ways how to load these libraries:
import numpy
import pylab
or
from pylab import *
From here I found this nice quote: http://old.nabble.com/pylab-td24910613.html
Numpy is the common core, providing N-dimensional arrays and math; matplotlib is a plotting library, using numpy; scipy is a collection of math/science functionality, also using numpy.Here is a decent (decent as in I still don't understand fully) explanation of the different import/package/library options:
http://johnstachurski.net/lectures/more_numpy.html
A quick aside on the relationship between Pylab and Matplotlib
One way to do plots with Matplotlib is like this
import pylab
pylab.plot([1, 2, 3])
pylab.show()
The same can be achieved by
import matplotlib.pyplot as plt
plt.plot([1, 2, 3])
plt.show()
What is the difference?
We can see the difference in the pylab initialization file:
## some stuff
from numpy import *
from numpy.fft import *
from numpy.random import *
from numpy.linalg import *
## some more stuff
from matplotlib.pyplot import *
## some more stuff
Thus,
import pylab brings in- everything from the NumPy namespace
- everything from various NumPy submodules (
random,linalg, etc.) - everything from
matplotlib.pyplot
The plotting functions are in
matplotlib.pyplotAnother explanation I found: http://code.activestate.com/lists/python-tutor/87392/
what is the basic difference between the commands
import pylab as *
import matplotlib.pyplot as plt
import numpy as np import numpy as *One response: http://code.activestate.com/lists/python-tutor/87394/
import pylab as * pollutes your global namespace with all kinds of symbols. If you don't know them all, you might accidentally use one of them in your own code, and wonder why things aren't working the way you expected. Better is import pylab and then use pylab.something to access a symbol from pylab Some prefer import pylab as pab (or something) and then use pab.something to save some typing. import matplotlib.pyplot as plt looks in the matplotlib *package" for the module pyplot, then imports it with a shortcut name of pltAnother response: http://code.activestate.com/lists/python-tutor/87400/
> what is the basic difference between the commands > import pylab as * Are you sure you don't mean from pylab import * ??? The other form won't work because * is not a valid name in Python. You should ghet a syntax error. > import matplotlib.pyplot as plt This is just an abbreviation to save typing matplotlib.pyplot in front of every reference to the module names. > import numpy as np as above > import numpy as * again an error.
Anyways, I would recommend reading on the structure of python here http://docs.python.org/contents.html which is what I plan on doing.
On to the plot.
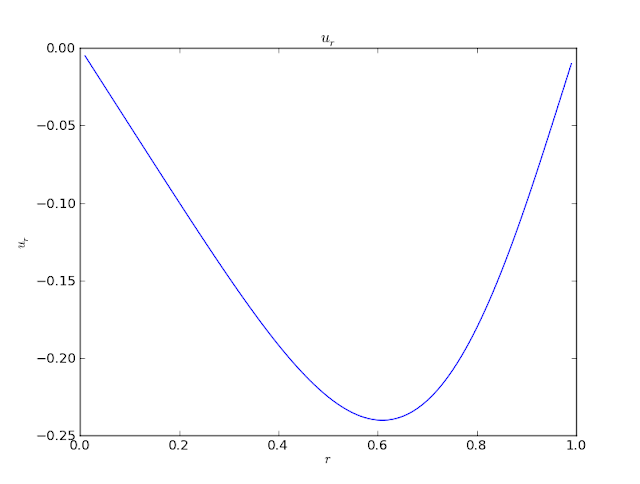
The code:
from pylab import *

r=arange(0,1,0.01)

z=arange(0,1,0.01)

sigma=1

l=1

kappa=1/(2*pi*sigma*l)

u=-(kappa/r)*sin(pi*pow(r, 2))

plot(r,u)

ylabel('$ u_r $')

xlabel('$ r $')

title('$ u_r $')

show()
The figure:

Screenshot of Spyder IDE:

Subscribe to:
Posts (Atom)