Thursday, June 28, 2012
25 Things I did After Installing Ubuntu 12.04 LTS "Precise Pangolin" | Tech Drive-in
25 Things I did After Installing Ubuntu 12.04 LTS "Precise Pangolin" | Tech Drive-in
I haven't really been able to use 12.04 much. I've been stuck with a Windows machine for awhile, :(. A couple of my computers needed hardware fixes. Here is some info on 12.04 anyways.
I haven't really been able to use 12.04 much. I've been stuck with a Windows machine for awhile, :(. A couple of my computers needed hardware fixes. Here is some info on 12.04 anyways.
Virgin Galactic to Launch New Cargo Plan, SpaceShip Design | Space.com
Virgin Galactic to Launch New Cargo Plan, SpaceShip Design | Space.com
Another nice space transport (an alternate to VG's space tourism concept) funded privately which could help the gap in space access.
Another nice space transport (an alternate to VG's space tourism concept) funded privately which could help the gap in space access.
X-48C Poised for Flight Tests
X-48C Poised for Flight Tests
Not hypersonics, but a nice concept to reduce noise and increase fuel efficiency for subsonic flight.
Not hypersonics, but a nice concept to reduce noise and increase fuel efficiency for subsonic flight.
Friday, June 22, 2012
Asymptote Vector Graphics Package
Asymptote
I've seen this before in my Ubuntu repository when searching for LaTeX packages. I want to try this one day. Asymptote is a vector graphics software, except it is all through its own programming language. At first, it seems scary, but in reality, it is the same thing as making a plot in Python, MATLAB, Mathematice, Sage, Maxima, etc. Asymptote seems nice since it seems very streamlined like LaTeX is for documents.
Asymptote is a powerful descriptive vector graphics language that provides a natural coordinate-based framework for technical drawing. Labels and equations are typeset with LaTeX, for high-quality PostScript output.
Thursday, June 21, 2012
Importing data into Python for a 2D plot
Yay! I'm learning some Python! (For Family Guy fans this is in Peter's voice when Lois lets him take his cage of parrots on a trip and he says, Yay, you're letting me be myself!).
So I needed to load a small sample of data (about 7 data points) into a 2D graph in Python. After awhile of searching and trial and error, I finally found a solution.
First, I had to figure out how to get Python to read the data and read it in a proper format or format that I needed for use. Basically, a 2x2 array for x and y values.
At first I thought plotfile under matplolib under cbook and using fname and get_sample_data would work.
http://matplotlib.sourceforge.net/api/pyplot_api.html#matplotlib.pyplot.plotfile
http://matplotlib.sourceforge.net/examples/pylab_examples/plotfile_demo.html
http://matplotlib.sourceforge.net/mpl_examples/pylab_examples/plotfile_demo.py
http://matplotlib.sourceforge.net/api/cbook_api.html?highlight=fname
I also tried the csv package/module/library or whatever the proper term is in Python and its reader function.
http://docs.python.org/release/2.5.2/lib/csv-examples.html
http://www.endlesslycurious.com/2011/05/06/graphing-real-data-with-matplotlib/
http://docs.python.org/library/csv.html#csv.reader
http://docs.python.org/library/csv.html
http://www.doughellmann.com/PyMOTW/csv/
I did get this to display my data in a table

However, I found loadtxt and upack=True but ended up using NumPy's genfromtxt which seems like they accomplish essentialyl the same thing, to load my data into a 2x2 matrix or array.
http://bulldog2.redlands.edu/facultyfolder/deweerd/tutorials/Tutorial-ReadingWritingData.pdf
http://www.programmingforbiologists.org/importing-data-python
http://docs.scipy.org/doc/numpy/reference/generated/numpy.genfromtxt.html
CSV stands for Comma Separated Value
http://docs.python.org/library/csv.html
So I imported my data into x and y using unpack=True to ensure that the data went into its own column. I then did some scaling using NumPy's multiply and divide. Then simple plotted onto a 2D graph using 'o' for data points only.
Screenshot:

http://matplotlib.sourceforge.net/examples/api/unicode_minus.html
http://matplotlib.sourceforge.net/mpl_examples/api/unicode_minus.py
http://docs.scipy.org/doc/numpy/reference/generated/numpy.divide.html
http://docs.scipy.org/doc/numpy/reference/generated/numpy.multiply.html
http://www.scipy.org/NumPy_for_Matlab_Users
Here is a NumPy tutorial and reference:
Tentative NumPy Tutorial - http://www.scipy.org/Tentative_NumPy_Tutorial
Numpy Example List - http://www.scipy.org/Numpy_Example_List
So I needed to load a small sample of data (about 7 data points) into a 2D graph in Python. After awhile of searching and trial and error, I finally found a solution.
First, I had to figure out how to get Python to read the data and read it in a proper format or format that I needed for use. Basically, a 2x2 array for x and y values.
At first I thought plotfile under matplolib under cbook and using fname and get_sample_data would work.
http://matplotlib.sourceforge.net/api/pyplot_api.html#matplotlib.pyplot.plotfile
http://matplotlib.sourceforge.net/examples/pylab_examples/plotfile_demo.html
http://matplotlib.sourceforge.net/mpl_examples/pylab_examples/plotfile_demo.py
http://matplotlib.sourceforge.net/api/cbook_api.html?highlight=fname
I also tried the csv package/module/library or whatever the proper term is in Python and its reader function.
http://docs.python.org/release/2.5.2/lib/csv-examples.html
http://www.endlesslycurious.com/2011/05/06/graphing-real-data-with-matplotlib/
http://docs.python.org/library/csv.html#csv.reader
http://docs.python.org/library/csv.html
http://www.doughellmann.com/PyMOTW/csv/
I did get this to display my data in a table
import csv
reader = csv.reader(open("some.csv", "rb"))
for row in reader:
    print row
Here is a screenshot:
However, I found loadtxt and upack=True but ended up using NumPy's genfromtxt which seems like they accomplish essentialyl the same thing, to load my data into a 2x2 matrix or array.
http://bulldog2.redlands.edu/facultyfolder/deweerd/tutorials/Tutorial-ReadingWritingData.pdf
http://www.programmingforbiologists.org/importing-data-python
http://docs.scipy.org/doc/numpy/reference/generated/numpy.genfromtxt.html
CSV stands for Comma Separated Value
http://docs.python.org/library/csv.html
The so-called CSV (Comma Separated Values) format is the most common import and export format for spreadsheets and databases. There is no “CSV standard”, so the format is operationally defined by the many applications which read and write it. The lack of a standard means that subtle differences often exist in the data produced and consumed by different applications. These differences can make it annoying to process CSV files from multiple sources. Still, while the delimiters and quoting characters vary, the overall format is similar enough that it is possible to write a single module which can efficiently manipulate such data, hiding the details of reading and writing the data from the programmer. The csv module implements classes to read and write tabular data in CSV format. It allows programmers to say, “write this data in the format preferred by Excel,” or “read data from this file which was generated by Excel,” without knowing the precise details of the CSV format used by Excel. Programmers can also describe the CSV formats understood by other applications or define their own special-purpose CSV formats.My code is:
import numpy as np
import matplotlib.pyplot as plt

x, y = np.genfromtxt('1952_Kelsall_ax_vel_ser_I_first_z_loc_closeup_2.csv', delimiter = ',', unpack=True)
y = np.multiply(1.62, y)
y = np.divide(y, 2885)

plt.plot(x, y, 'o')

plt.show()
So I imported my data into x and y using unpack=True to ensure that the data went into its own column. I then did some scaling using NumPy's multiply and divide. Then simple plotted onto a 2D graph using 'o' for data points only.
Screenshot:

http://matplotlib.sourceforge.net/examples/api/unicode_minus.html
http://matplotlib.sourceforge.net/mpl_examples/api/unicode_minus.py
http://docs.scipy.org/doc/numpy/reference/generated/numpy.divide.html
http://docs.scipy.org/doc/numpy/reference/generated/numpy.multiply.html
http://www.scipy.org/NumPy_for_Matlab_Users
Here is a NumPy tutorial and reference:
Tentative NumPy Tutorial - http://www.scipy.org/Tentative_NumPy_Tutorial
Numpy Example List - http://www.scipy.org/Numpy_Example_List
Tuesday, June 19, 2012
NASA - June 21, 1962 - This Week in Dryden's History - X-15 #3
NASA - June 21, 1962
June 21, 1962The dawn of hypersonics. One of my favorite vehicles, the X-15.
During a preflight checkout of X-15 #3, a ground crewman writes in the frost covering its underside "250,000 OR NO ICE CREAM." Maj. Robert White reached only 246,700 feet.
Saturday, June 16, 2012
Air Force's Secret X-37B Space Plane Lands in California | Space.com
Air Force's Secret X-37B Space Plane Lands in California | Space.com
Forgot about this guy. Some more good news on the hypersonic and space access front.
Forgot about this guy. Some more good news on the hypersonic and space access front.
Tuesday, June 12, 2012
NASA - June 16, 1965 - The M2-F2 lifting body arrives by truck...
NASA - June 16, 1965
The M2-F2 lifting body arrives by truck at the Flight Research Center. A year would pass before it would make its first flight. After being horribly damaged in a crash landing, it was modified and renamed the "M2-F3."This is one vehicle part of the lifting-body program which paved the way for unpowered lifting body landing, the STS or more commonly known as the Space Shuttle.
Monday, June 11, 2012
NASA awards UT Arlington aerospace engineers grant to study hypersonic propulsion for space access | Cision Wire
NASA awards UT Arlington aerospace engineers grant to study hypersonic propulsion for space access | Cision Wire
Good to see. I hope they research the past well, as not to repeat but move forward.
Good to see. I hope they research the past well, as not to repeat but move forward.
Sunday, June 10, 2012
Success! - First Mayavi Plot
Recently, I started Python from a fresh re-install of Python(x, y). Confident I had everything, including Mayavi, installed correctly. I tried to re-run some examples I found online. This time I did not receive any error messages regarding that Mayavi could not be recognized. However, I was/am still having problems.
I decided to try to open Mayavi from the Start Menu in Windows under the Python(x, y) folder structure. It worked! That is, Mayavi opened as a separate console/program. I found Run Python Script under the File heading. I tried to run one of my previous files, and this time it really did work!!
This is the spherical harmonic example using the mesh() function (although the example is a little different, maybe I got it from somewhere else; can't remember) from the Mayavi website:
http://docs.enthought.com/mayavi/mayavi/auto/examples.html
http://docs.enthought.com/mayavi/mayavi/index.html
http://docs.enthought.com/mayavi/mayavi/auto/mlab_helper_functions.html#
http://docs.enthought.com/mayavi/mayavi/auto/mlab_helper_functions.html#mesh
Edit: I found the example, it is the provided demo - http://docs.enthought.com/mayavi/mayavi/mlab.html#simple-scripting-with-mlab
My screenshots:


However, I could not get the flow() function example to work, :(, which I would like to use for 3D streamline plots.
Edit: I got the test flow to work. Just remove the def and return and unindent the rest. (However, I still have very little grasp on how MayaVi works as I am having great difficulty in trying to produce streamlines from a velocity vector field. Concept seems simple enough but... I also still cannot get MayaVi to work from Spyder. Very frustrating!!!!)
I did get another 3D plot example I found to work which also uses the mesh() function.
http://www.sam.math.ethz.ch/~hheumann/Tutorial/html/mayavi2_tips.html

I decided to try to open Mayavi from the Start Menu in Windows under the Python(x, y) folder structure. It worked! That is, Mayavi opened as a separate console/program. I found Run Python Script under the File heading. I tried to run one of my previous files, and this time it really did work!!
This is the spherical harmonic example using the mesh() function (although the example is a little different, maybe I got it from somewhere else; can't remember) from the Mayavi website:
http://docs.enthought.com/mayavi/mayavi/auto/examples.html
http://docs.enthought.com/mayavi/mayavi/index.html
http://docs.enthought.com/mayavi/mayavi/auto/mlab_helper_functions.html#
http://docs.enthought.com/mayavi/mayavi/auto/mlab_helper_functions.html#mesh
Edit: I found the example, it is the provided demo - http://docs.enthought.com/mayavi/mayavi/mlab.html#simple-scripting-with-mlab
from numpy import *
from enthought.mayavi import mlab
# Create the data.
dphi, dtheta = pi/250.0, pi/250.0
[phi,theta] = mgrid[0:pi+dphi*1.5:dphi,0:2*pi+dtheta*1.5:dtheta]
m0 = 4; m1 = 3; m2 = 2; m3 = 3; m4 = 6; m5 = 2; m6 = 6; m7 = 4;
r = sin(m0*phi)**m1 + cos(m2*phi)**m3 + sin(m4*theta)**m5 + cos(m6*theta)**m7
x = r*sin(phi)*cos(theta)
y = r*cos(phi)
z = r*sin(phi)*sin(theta);
# View it.
f = mlab.figure()
s = mlab.mesh(x, y, z)
My screenshots:


However, I could not get the flow() function example to work, :(, which I would like to use for 3D streamline plots.
import numpy
import enthought
from mayavi.mlab import *

def test_flow():
    x, y, z = numpy.mgrid[0:5, 0:5, 0:5]
    r = numpy.sqrt(x**2 + y**2 + z**4)
    u = y*numpy.sin(r)/r
    v = -x*numpy.sin(r)/r
    w = numpy.zeros_like(z)
    obj = flow(u, v, w)
    return obj
Edit: I got the test flow to work. Just remove the def and return and unindent the rest. (However, I still have very little grasp on how MayaVi works as I am having great difficulty in trying to produce streamlines from a velocity vector field. Concept seems simple enough but... I also still cannot get MayaVi to work from Spyder. Very frustrating!!!!)
import numpy
import enthought
from mayavi.mlab import *

x, y, z = numpy.mgrid[0:5, 0:5, 0:5]
r = numpy.sqrt(x**2 + y**2 + z**4)
u = y*numpy.sin(r)/r
v = -x*numpy.sin(r)/r
w = numpy.zeros_like(z)
obj = flow(u, v, w)
I did get another 3D plot example I found to work which also uses the mesh() function.
http://www.sam.math.ethz.ch/~hheumann/Tutorial/html/mayavi2_tips.html
from numpy import mgrid, real, conj, ones, zeros
from numpy.fft.fftpack import fft2
from numpy.fft.helper import fftshift
from enthought.mayavi import mlab

# A mesh grid
X,Y = mgrid[-100:100, -100:100]

# The initial function: a 2D unit step
Z = zeros((200,200))
Z[0:6,0:6] = 0.3*ones((6,6))

# The fourier transform: a 2D sinc(x,y)
W = fftshift(fft2(Z))
W = real(conj(W)*W)

# Display the data with mayavi
# Plot the original function
#mlab.mesh(X, Y, Z)
# Plot the fourier transformed function
mlab.mesh(X, Y, W)
mlab.savefig("mayavi_fft_plot.png")

Saturday, June 9, 2012
Getting Python to work in Windows - Python 2.7.2, Python(x, y) 2.7.2.3, Sypder2, and Mayavi2
Ok, whew, I finally got a good grasp on installing Python in Windows 7. I had it installed first (through Python(x,y) also apparently) but was having issues with getting Mayavi to work (or so I thought then, could have been ok I just didn't understand the structure until I got it to work now; not sure if I really understand, but whatever, it works).
So, I decided to uninstall everything again, and then re-install because I really had forgotten how I did it in the first place. After some googling and browsing, I knew I wanted to use and install Spyder because I had it before. So I went to the site http://packages.python.org/spyder/installation.html then found a link to https://code.google.com/p/spyderlib/. However, I kept seeing Windows - Python(x,y). So read and browsed a little more to find that Python(x,y) is a one stop for all source. It not only installs Python, Spyder, IPython, and libraries such as Numpy, Scipy, Matplotlib, etc., but it also installs many other packages such as the IDLE simple IDE/editor, Mayavi2, etc. (all are options of course). Python(x, y) also is integrated with or as (I don't yet understand) a Qt framework (again, not so sure what Qt is/does; like Java app development maybe?).
Qt links:
http://qt.nokia.com/
http://qt.nokia.com/products
Here is a nice schematic displaying the integration of Python(x, y) from http://code.google.com/p/pythonxy/wiki/Welcome

Python(x, y) home page link: http://code.google.com/p/pythonxy/
Python(x, y) installer download page: http://code.google.com/p/pythonxy/wiki/Downloads
The latest Python(x, y) version is 2.7.2.3 and simply download and run the installer .exe file: Python(x,y)-2.7.2.3.exe

I kept everything default under the installation except I added the SymPy library/package under the Python expansion.


Important note! The Mayavi website says to make sure ETS (short for Enthought Software?) is checked for the installation of Mayavi.
http://docs.enthought.com/mayavi/mayavi/installation.html
Python(x, y) installs with it Python 2.7.2

Although, there have been releases of Python 3.x (3.2.3 as the latest stable) and a more recent 2.7.x as 2.7.3. It seems that packages aren't caught up to 3.x yet, so it may be best to use 2.7.x for now? See these links for more:
http://www.python.org/
http://www.python.org/download/releases/2.7.3/
http://wiki.python.org/moin/Python2orPython3
After installation, I feel more comfortable and confident that Python and packages such as Mayavi are installed properly. I was getting an error before that Mayavi couldn't be found.
This is proof!
 Spyder is installed too.

So, I decided to uninstall everything again, and then re-install because I really had forgotten how I did it in the first place. After some googling and browsing, I knew I wanted to use and install Spyder because I had it before. So I went to the site http://packages.python.org/spyder/installation.html then found a link to https://code.google.com/p/spyderlib/. However, I kept seeing Windows - Python(x,y). So read and browsed a little more to find that Python(x,y) is a one stop for all source. It not only installs Python, Spyder, IPython, and libraries such as Numpy, Scipy, Matplotlib, etc., but it also installs many other packages such as the IDLE simple IDE/editor, Mayavi2, etc. (all are options of course). Python(x, y) also is integrated with or as (I don't yet understand) a Qt framework (again, not so sure what Qt is/does; like Java app development maybe?).
Qt links:
http://qt.nokia.com/
http://qt.nokia.com/products
Here is a nice schematic displaying the integration of Python(x, y) from http://code.google.com/p/pythonxy/wiki/Welcome

Python(x, y) home page link: http://code.google.com/p/pythonxy/
Python(x, y) installer download page: http://code.google.com/p/pythonxy/wiki/Downloads
The latest Python(x, y) version is 2.7.2.3 and simply download and run the installer .exe file: Python(x,y)-2.7.2.3.exe

I kept everything default under the installation except I added the SymPy library/package under the Python expansion.


Notice all the packages that come with Python(x, y):


Important note! The Mayavi website says to make sure ETS (short for Enthought Software?) is checked for the installation of Mayavi.
http://docs.enthought.com/mayavi/mayavi/installation.html
Python(x, y) installs with it Python 2.7.2

Although, there have been releases of Python 3.x (3.2.3 as the latest stable) and a more recent 2.7.x as 2.7.3. It seems that packages aren't caught up to 3.x yet, so it may be best to use 2.7.x for now? See these links for more:
http://www.python.org/
http://www.python.org/download/releases/2.7.3/
http://wiki.python.org/moin/Python2orPython3
After installation, I feel more comfortable and confident that Python and packages such as Mayavi are installed properly. I was getting an error before that Mayavi couldn't be found.
This is proof!


Thursday, June 7, 2012
Pidgin IM - How to enable Pidgin on startup - Windows
Tools -> Plugins -> Windows Pidgin Options -> check box -> Configure Plugin -> Start Pidgin on Windows startup


http://answers.yahoo.com/question/index?qid=20080423182809AAcjwYy


http://answers.yahoo.com/question/index?qid=20080423182809AAcjwYy
Wednesday, June 6, 2012
Tuesday, June 5, 2012
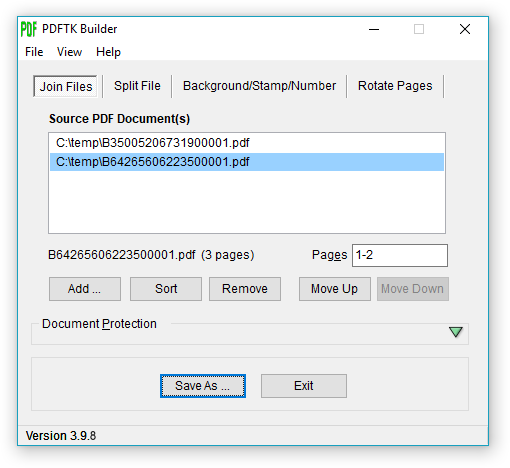
PDF editor, free, for Windows for rotating PDFs - PDFTK Builder
PDFTK Builder is a nice free software with a good GUI in case you need to do minor changes to a PDF file such as rotating a PDF scan (my case).
Edit: This is also great for splitting and merging pdfs!
http://angusj.com/pdftkb/#pdftkbuilder
Full installation (includes PDFTK ver 1.41): 2 MB
http://angusj.com/pdftkb/pdftkb_setup.exe
Edit: This is also great for splitting and merging pdfs!
http://angusj.com/pdftkb/#pdftkbuilder
Full installation (includes PDFTK ver 1.41): 2 MB
http://angusj.com/pdftkb/pdftkb_setup.exe
Inkscape - change "Save As..." directory
Under File -> Inkscape Perferences -> go to Save -> see if box for Use current directory for "Save As..." is checked or not.


Inkscape - change saving area of the drawing
If you have a bunch of objects on your Inkscape page and you want to only export/save a portion of that, then first select the object(s) you want go to File -> Document Properties -> under the Page tab -> expand the Custom Size area if needed -> then select Resize page to drawing or selection


Subscribe to:
Posts (Atom)