Showing posts with label Maxima. Show all posts

Thursday, July 19, 2012

Some common functions in Maxima - trig, logarithms, the exponential, and square root

http://maxima.sourceforge.net/docs/manual/en/maxima_10.html#SEC47

exp(x)
log(x)
sqrt(x)
acos(x)
acosh(x)
acot(x)
acoth(x)
asin(x)
asinh(x)
asec(x)
asech(x)
acsc(x)
acsch(x)
atan(x)
atanh(x)
cos(x)
cosh(x)
cot(x)
coth(x)
sin(x)
sinh(x)
sec(x)
sech(x)
csc(x)
csch(x)
tan(x)
tanh(x)
Maxima does not have a built-in function for the base 10 logarithm or other bases. log10(x) := log(x) / log(10) is a useful definition.

Saturday, July 14, 2012

Maxima/wxMaxima - solving for the roots of a transcendental equation

Ok, so something is wrong with my Python.  I think Spyder is giving me some fits in Ubunt for somereason.  Anyways, luckily I have Maxima and Sage to fall back on.  In order to solve for the roots of a transcendental equation, I provide a following example.

The equation I want to solve is:

\[ \tan \left( \tfrac{1}{2} C d^2 \right) - \tan \left( \tfrac{1}{2} C a^2 \right) = 0 \]

where \( \deta \) is given.  I first plotted it to make sure it did in fact show trends of a root or roots for \( \delta = 0.5\).

delta:0.5;
eqn(x):= tan(0.5*x*(delta^2)) - tan(0.5*x);
plot2d(eqn, [x, 0, 20],[y, -1, 1]);

So, yup, it definitely has roots.  The first root is actually at zero, but this is trivial in my case.  So I am interesting in the second root.  It seems to be around 8.  I choose the interval for the root finder to look on as 7.8 to 8.5.

find_root(tan(0.5*x*(delta^2)) - tan(0.5*x), x, 7.8, 8.5);
8.377580409572781

So the root found is the bold number above!

Friday, July 13, 2012

Installing/updating Maxima and wxMaxima to 5.27 and 12.04, respectively

It had been awhile since I had used wxMaxima/Maxima on my desktop, and I was getting an error when I was trying to run calculations that wxMaxima was not connected to Maxima.  I began to search for a solution then decided to check the version.  A newer version had of course come out for Maxima-xMaxima as 5.27 and wxMaxima as 12.04.  I decide that upgrading would be easier and more logical than trying to fix the old version I had.

First, I removed the old version.  You can probably do this through through SPM, the terminal, or (what I did) USC.  Then add the repository from blahota on launchpad:

https://launchpad.net/~blahota/+archive/wxmaxima/

apt-add-repository ppa:blahota/wxmaxima


I already had this added from an older version upgrade.  Then run update to update the repositories:

sudo apt-get update


Then install wxMaxima and Maxima either through the terminal (not sure of the exact command; probably something like sudo apt-get install maxima or whatever the file name is), USC, or (what I did) through SPM.  I just selected what I wanted to install.


Sunday, January 29, 2012

Maxima and wxMaxima in Windows 7

I am forced to use Windows every now and then, but I have recently found out that some of my favorite software works for Windows and is relatively easy to install.  Maxima is very easy, as you just download and run the Windows installer from here:  http://www.windows7download.com/win7-maxima/kqcjkmcz.html

Installing Maxima for Windows also installs wxMaxima (and Xmaxima if wanted) and gnuplot.  Here is a screenshot.


Friday, December 30, 2011

Moving the legend location in Maxima/Gnuplot

I had a plot where the function graph intersected the legend at its default position in the upper right hand corner.  I finally found a command which will move it to the lower right instead.  I'm sure you can move it to where you like, but this is the only one I found so far.  The command is:

[gnuplot_preamble,"set key bottom"]


For example,

plot2d([legendre_p(0, x), legendre_p(1, x), legendre_p(2, x),legendre_p(3, x), legendre_p(4, x), legendre_p(5, x)], [x, 0, 2], [y, -2, 5], [legend,"P_0 (x) = 1","P_1 (x) = x","P_2 (x) = (1/2)*(3*x^2 - 1)", "P_3 (x) = (1/2)*x*(5*x^2 - 3)","P_4 (x) = (1/8)*(35*x^4 - 30*x^2 + 3)","P_5 (x) = (1/8)*x*(63*x^4 - 70*x^2 + 15)" ], [ylabel,"P_n (x)"], [gnuplot_preamble,"set key bottom"]);


Found this here: http://maxima.sourceforge.net/maxima-gnuplot.html

Editing axis and legend labels in Maxima/Gnuplot

The commands for editing the labels for the x and y axes in Maxima are:

[xlabel,"expr"]

and

[ylabel,"expr"]

where expr is the argument holder where you place your text for whatever label you are wanting.  The quotes " " are necessary.

The command for the legend label is:

[legend,"expr1","expr2"]

where expr1, expr2, etc. are the argument holders where you place your text for whatever labels you are wanting depending on the number of legend labels.

These commands go inside your overall plot command.  For example,

plot2d(func, x, [xlabel,"expr"], [ylabel,"expr"], [legend,"expr1","expr2"])

Found these commands here: http://maxima.sourceforge.net/docs/manual/en/maxima_12.html#SEC65

Monday, December 26, 2011

Differentiation in Maxima

Mathematica is a great piece of software.  You can do many things with it mathematically.  However, it is not free and not always available.  I am trying to find some replacements that are free, cross-platform, readily available, relatively easy to use.

I have been trying at Maxima using the wxMaxima interface and have been quite pleased with it.  So far I have been able to graph functions related to my research.  However, Mathematica is pretty powerful as you can do differentiation, integration, etc. with ease.  Just recently, I tried the differentiation ability of Maxima.  It is possible to do differentiation in Maxima.  So far I have only tried a simple polynomial.  The command for differentiation is:

diff(expr, x)

Here is a screen shot of some examples I did.


Now if I could figure out if and how to simplify the last expression.  If Maxima can do that, then it is a very viable option to Mathematica for several things.

I found this differentiation command at http://mathandmultimedia.com/tag/maxima-tutorial/

Update:  So as you might have noticed I got a great tip in the comments on how to simplify this fraction.  The tip comes from Mike Croucher who has a great, insightful blog http://www.walkingrandomly.com/ which I must admit I don't read often enough due to time but check it out anyways.  It is well established and post similar topics yet more advanced and involved examples.


Sunday, December 25, 2011

Legendre functions (also associated) of the first and second kind in Maxima

In order to do Legendre functions in Maxima the command is

legendre_p(n, x)

where n is the degree of the polynomial.  For example, for the Legendre polynomial of the first kind of the 5th degree simply type legendre_p(5, x).


For the Legendre function of the second kind the command is

legendre_q(n, x)


For the associated Legendre functions where there is also an order, m, in addition to the degree, n, to specify. Remember that regular Legendre functions are just associated Legendre functions of order 0.

assoc_legendre_q(n, m, x)

assoc_legendre_q(n, m, x)


Here are some links to these commands and more special functions and orthogonal functions/polynomials.

http://www.ma.utexas.edu/maxima/maxima_16.html

Although this link^ has the regular Legendre function with an order which is not needed.  It is listed as

legendre_p(n, m, x)

where it should just be like it is posted above.

Friday, December 23, 2011

Legendre polynomials of the first kind, plots of degrees n = 0, 1, 2, 3, 4, 5

\( P_0 \left( x \right) = 1 \)


\( P_1 \left( x \right) = x \)


\( P_2 \left( x \right) = \dfrac{1}{2} \left( 3 x^2 - 1 \right) \)


\( P_3 \left( x \right) = \dfrac{1}{2} x \left( 5 x^2 - 3 \right) \)


\( P_4 \left( x \right) = \dfrac{1}{8} \left( 35 x^4 - 30 x^2 + 3 \right) \)


\( P_5 \left( x \right) = \dfrac{1}{8} x \left( 63 x^4 - 70 x^2 + 15 \right) \)


\( P_0 \left( x \right), P_1 \left( x \right), P_2 \left( x \right), P_3 \left( x \right), P_4 \left( x \right), P_5 \left( x \right) \)


Code for last graph in wxMaxima:

plot2d([legendre_p(0, x), legendre_p(1, x), legendre_p(2, x),legendre_p(3, x), 
legendre_p(4, x), legendre_p(5, x)], [x, -2, 2], [y, -2, 2], 
[legend,"P_0 (x) = 1","P_1 (x) = x","P_2 (x) = (1/2)*(3*x^2 - 1)",
"P_3 (x) = (1/2)*x*(5*x^2 - 3)","P_4 (x) = (1/8)*(35*x^4 - 30*x^2 + 3)",
"P_5 (x) = (1/8)*x*(63*x^4 - 70*x^2 + 15)" ], [ylabel,"P_n (x)"], [gnuplot_preamble,"set key bottom"]);

Saturday, November 26, 2011

sin(x) + cos(x)


\( \sin x + \cos x \)

Code for Maxima:

f(x) := sin(x) + cos(x)
plot2d(f(x), [x, 0, 7], [y, -2, 2]);


sin(x) - cos(x)


\( \sin x - \cos x \)

Code for Maxima:

f(x) := sin(x) - cos(x)
plot2d(f(x), [x, 0, 7], [y, -2, 2]);


Friday, November 25, 2011

tan(x)


\( \tan x \)

Code for Maxima:

plot2d(tan(x), [x, 0, 7], [y, -2, 2]);


sin(x) + cos(x)


\( \sin x + \cos x \)

Code for Maxima:

plot2d(sin(x)+cos(x), [x, 0, 7]);


Bessel function of the second kind, orders 0, 1, 2


\( Y_0 \left( x \right) \)

Code to plot in wxMaxima:
plot2d(bessel_y (0, x), [x, 0, 20], [y, -2, 1]);


\( Y_1 \left( x \right) \)

Code to plot in wxMaxima:
plot2d(bessel_y (1, x), [x, 0, 20], [y, -2, 1]);


\( Y_2 \left( x \right) \)

Code to plot in wxMaxima:
plot2d(bessel_y (2, x), [x, 0, 20], [y, -2, 1]);


\( Y_0 \left( x \right), \quad Y_1 \left( x \right), \quad Y_2 \left( x \right) \)

Code to plot in wxMaxima:
plot2d([bessel_y (0, x), bessel_y (1, x), bessel_y (2, x)], [x, 0, 20]);


Bessel functions of the first kind, orders 0, 1, 2

Since Lybniz only recognizes the python standard math library, I used wxMaxima to plot the Bessel functions.

\( J_0 \left( x \right) \)

Code to plot in wxMaxima:
plot2d(bessel_j (0, x), [x, 0, 20]);


\( J_1 \left( x \right) \)

Code to plot in wxMaxima:
plot2d(bessel_j (1, x), [x, 0, 20]);


\( J_2 \left( x \right) \)

Code to plot in wxMaxima:
plot2d(bessel_j (1, x), [x, 0, 20]);


\( J_0 \left( x \right), \quad J_1 \left( x \right), \quad J_2 \left( x \right) \)

Code to plot in wxMaxima:
plot2d([bessel_j (0, x), bessel_j (1, x), bessel_j (2, x)], [x, 0, 20]);


Bessel function syntax in Maxima

The commands for Bessel functions in Maxima are:

Bessel function 1st kind: \( J_n \left( x \right) \)
bessel_j (index, expr)

Bessel function 2nd kind: \( Y_n \left( x \right) \)
bessel_y (index, expr)

Modified Bessel function 1st kind: \( I_n \left( x \right) \)
bessel_i (index, expr)

Modified Bessel function 2nd kind: \( K_n \left( x \right) \)
bessel_k (index, expr)

http://maxima.sourceforge.net/docs/manual/en/maxima_15.html

Thursday, September 22, 2011

wxMaxima - 2D plots with one or more functions

Alright so let's keep this ball rolling.  Next, I would like to enter an equation as a function and then plot that function on a 2D graph in Maxima.  I would also like to gauge this function versus a couple of more so I will have three functions plotted on the same graph.

As a continuation from the previous post, I am entering in and defining a function for tangential velocities.  It is as easy as before.  I set

u_theta2(u):= %pi*(lamb_da(al_pha) + csc(u)*cot(u) - (csc(u))^2 - log(tan(u/2)));

or

\[ u_{\theta} = \pi \left( \lambda + \csc \phi \cot \phi - \csc^2 \phi - \ln \Phi \right) \]

where \( \Phi = \tan \dfrac{\phi}{2} \).

Right now I am using the variable "u" in place of \( \phi \).  I will try to change that to "phee" later.I will aslo try to make a function for "big_phee" for \( \Phi \) too.

I also create the function one_over_R_sin(u) for comparison and choose a constant \( R \) while varying \( \phi \).

one_over_R_sin(u):= 1/(0.7*sin(u));

\[ u_{\theta} = \dfrac{1}{R \sin \phi} \]

Then we can plot by

plot2d([u_theta2(u), one_over_R_sin(u)], [u, 0.00001, %pi/6], [y, 0, 20]);

So the plot2d a 2-d graph or plot.  The first argument allow you to plot more than one function as the notation of [f(x), g(x)],.  If we were to just plot one function there would be no need for the square brace [ ] but instead just the function f(x),.  The next argument allows the range for the "x" variable which in this case is u.  So I let u range from 0 to my angle \(\alpha \) of \( 30^{\circ} \) or \( \dfrac{\pi}{6} \) radians.  This must be encased in a square brace [ ].  Then, if we like, we can give a range for the "y-axis" which I ranged from 0 to 20.


wxMaxima - defining a parameter/variable and a function

Ok, so here is one of my shots at Maxima/wxMaxima.  My goal is to define a parameter/variable then use it in a function I have defined myself.

My variable is alpha, \( \alpha \), but I defined it as al_pha since Maxima doesn't like variables that are already defined and many of those are Greek variables.  I just broke it up phonetically.  I set alpha to be a constant by

al_pha: 30*%pi/180

(I think using just "pi" works too.  It does, it just leaves it in symbolic form.  See screen shots.)

The colon (:) provides the capability to define the variable  al_pha in Maxima.  I also multiplied by Pi and divided by 180 in order to get al_pha from degrees (30) into radians since I am going to be dealing with trigonometric functions.

Next, I define my function as lamb_da as

lamb_da(x):= (csc(x))^2

Note, that I used "x" even though I want the angle alpha.  We will call lamb_da for al_pha later.  So the colon (:) plus the equal sign (=) attains a function definition in Maxima.  Also note that in order to square cosecant in Maxima I had to wrap in parentheses and then square.  I also could have done

csc(x)*csc(x)

but who wants to do that for 2 or higher?!

Screen shots:


Notice the difference between using %pi and pi gives 4 and \( \csc ^2 \left( \dfrac{\pi}{6}\right) \), respectively.

I then add more to lamb_da once I know it is working properly.


I can check it with KAlgebra.


I found this very good pdf where I discovered how to define a function and parameter:

resources.eun.org/xplora/Maxima_Xplora.pdf

Also this can be found in the Maxima documentation here:

7.6 Assignment operators - http://maxima.sourceforge.net/docs/manual/en/maxima_7.html#SEC41

Tuesday, August 30, 2011

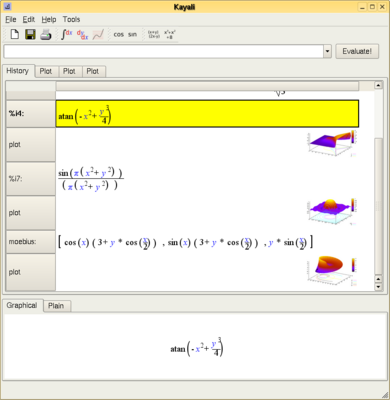
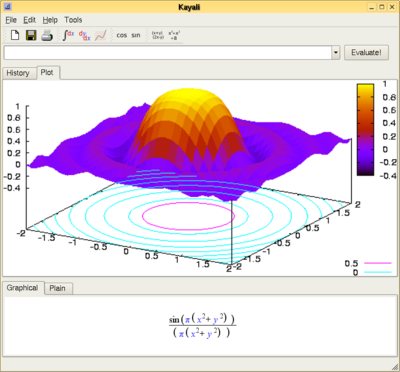
Kayali - a Qt based Computer Algebra System

Kayali - http://kayali.sourceforge.net

Overview

Kayali is a Qt based Computer Algebra System (CAS) that can also be used as an advanced replacement for KDE KCalc. It is essentially a front end GUI for Maxima (and is easily extended to other CAS back-ends) and Gnuplot.

Please Note: I am currently targetting a small subset of Maxima, while maintaining a medium-term goal of supporting all of Maxima. Please bear in mind that although Kayali probably does not support what you want to do with it right now, it can be made do so - but I need your feedback to do that. Please try it out if you can and share your thoughts.

Kayali is currently alpha software and has only been tested on my own PC. It you are reading this (condition1 : satisfied) and are prepared to give it a go, then please do send me feedback as to how you get on. At this stage I am particularly looking for hints about where to focus my development efforts, so please email me or post a message to the Kayali sourceforge forum with what you would like to see Kayali support.

I expect to see rapid development of Kayali so please check back regularly for updates.


Requires

Python

Kayali has been written in Python. Nearly all linux installations already have python installed.

Python Web Site

Maxima

Maxima is the engine behind Kayali. It is called a CAS (Computer Algebra System). Kayali passes all its commands to Maxima, so to learn more about the advanced use of Kayali you need to learn Maxima:

Maxima Sourceforge Web Site

PyQt4

PyQt4 is the interface between Python, which Kayali is written in, and Qt4. Qt4 is a great development toolkit developed by Trolltech in Norway.

Trolltech Qt Web Site

Riverbank PyQt Web Site

GnuPlot

(Only required for plotting) GnuPlot is a plotting utility under the GNU umbrella. The 3D plots require v4 or above.

GnuPlot Web Site

libgd

(Only required for plotting) libgd is a gif manipulation library needed by gnuplot to produce png files.

libgd Web Site

User Documentation

Until Kayali reaches beta there is no user documentation. However, a little exploration of the system will go a long way. To learn the more advanced usage of Kayali, go to the Maxima web site.

Maxima Sourceforge Web Site

Acknowledgements

Yapps

Yapps is a python-based parser which I have used for parsing the expressions.

Yapps Web Site

Pexpect

Pexpect is a python-based implementation of Expect, which I am using to communicate with Maxima.

Pexpect Web Site