Install Spotify Client in Ubuntu 11.10 (Oneiric Ocelot) | Liberian Geek
SWEET!!
Archival purposes:
Terminal:
sudo apt-key adv --keyserver keyserver.ubuntu.com --recv-keys 4E9CFF4E
sudo gedit /etc/apt/sources.list.d/spotify.list
Write to text file and then save:
deb http://repository.spotify.com stable non-free
Again in the terminal:
sudo apt-get update
sudo apt-get install spotify-client-qt
Monday, April 23, 2012
Sunday, April 22, 2012
Xlib: extension "RANDR" missing on display ":0" error
So I was trying to run a simple code for a contour plot using the Spyder Python IDE and this error popped up:
Xlib: extension "RANDR" missing on display ":0"
Through Google, I found that the solution was to install this package from the USC:
gtk2-engines-pixbuf
I ran the code again, the error message was gone, and it generated my plot.
Found solution here:
http://askubuntu.com/questions/66356/gdk-gtk-warnings-and-errors-from-the-command-line
http://yoodey.com/solving-gtk-warning-unable-locate-theme-engine-modulepath-pixmap
Saturday, April 21, 2012


Friday, April 20, 2012
Removing page number from title page - LaTeX - Formatting
Simply use the command \thispagestyle{empty} after the /\maketitle command.
http://www.latex-community.org/forum/viewtopic.php?f=5&t=225
http://tex.stackexchange.com/questions/1736/removing-page-number-for-title-page
http://www.latex-community.org/forum/viewtopic.php?f=5&t=225
http://tex.stackexchange.com/questions/1736/removing-page-number-for-title-page
Thursday, April 19, 2012
Update on the xfrac LaTeX package (\sfrac command) - TeX Live - Ubuntu 11.10
I was trying to compile my LaTeX document and thought I had all the packages I needed for TeX Live because I was working on a fairly new computer on which I had just installed Ubuntu 11.10 and relevant goodies. I had the xfrac package initialized in the preamble and was using the /sfrac command for a better looking slanted fraction. I was getting an error:
"xfrac.sty not found"
and was quite confused because I thought I had all the dependencies installed. The old dependency was texlive-math-extra, but it has now been moved to texlive-latex3. I scrolled through the USC and sure enough I had missed this package install. Installed it, and BAM! It works!!
Wednesday, April 18, 2012
Python - 2d plot - matplotlib
Woohoo! I did my first plot in Python!! I am trying out Python because it seems to offer many utilities I can use in one place for various scientific research capabilities. In Ubuntu 11.10 I have installed the Spyder IDE and a few libraries such as scipy, numpy, matplotlib, and mayavi. Eventually, I want to plot 3-D streamlines which is where mayavi comes into to play, thus I need to learn Python. Plus, Sage can also use Python which I plan to experiment with later.
I am still very green to Python although I do have some programming experience (mainly MATLAB and a C class I took about 9 years ago, :P!!). For example, I've seen a few ways how to load these libraries:
or
From here I found this nice quote: http://old.nabble.com/pylab-td24910613.html
http://johnstachurski.net/lectures/more_numpy.html
Another explanation I found: http://code.activestate.com/lists/python-tutor/87392/
Anyways, I would recommend reading on the structure of python here http://docs.python.org/contents.html which is what I plan on doing.
On to the plot.
The code:
The figure:
Screenshot of Spyder IDE:

I am still very green to Python although I do have some programming experience (mainly MATLAB and a C class I took about 9 years ago, :P!!). For example, I've seen a few ways how to load these libraries:
import numpy
import pylab
or
from pylab import *
From here I found this nice quote: http://old.nabble.com/pylab-td24910613.html
Numpy is the common core, providing N-dimensional arrays and math; matplotlib is a plotting library, using numpy; scipy is a collection of math/science functionality, also using numpy.Here is a decent (decent as in I still don't understand fully) explanation of the different import/package/library options:
http://johnstachurski.net/lectures/more_numpy.html
A quick aside on the relationship between Pylab and Matplotlib
One way to do plots with Matplotlib is like this
import pylab
pylab.plot([1, 2, 3])
pylab.show()
The same can be achieved by
import matplotlib.pyplot as plt
plt.plot([1, 2, 3])
plt.show()
What is the difference?
We can see the difference in the pylab initialization file:
## some stuff
from numpy import *
from numpy.fft import *
from numpy.random import *
from numpy.linalg import *
## some more stuff
from matplotlib.pyplot import *
## some more stuff
Thus,
import pylab brings in- everything from the NumPy namespace
- everything from various NumPy submodules (
random,linalg, etc.) - everything from
matplotlib.pyplot
The plotting functions are in
matplotlib.pyplotAnother explanation I found: http://code.activestate.com/lists/python-tutor/87392/
what is the basic difference between the commands
import pylab as *
import matplotlib.pyplot as plt
import numpy as np import numpy as *One response: http://code.activestate.com/lists/python-tutor/87394/
import pylab as * pollutes your global namespace with all kinds of symbols. If you don't know them all, you might accidentally use one of them in your own code, and wonder why things aren't working the way you expected. Better is import pylab and then use pylab.something to access a symbol from pylab Some prefer import pylab as pab (or something) and then use pab.something to save some typing. import matplotlib.pyplot as plt looks in the matplotlib *package" for the module pyplot, then imports it with a shortcut name of pltAnother response: http://code.activestate.com/lists/python-tutor/87400/
> what is the basic difference between the commands > import pylab as * Are you sure you don't mean from pylab import * ??? The other form won't work because * is not a valid name in Python. You should ghet a syntax error. > import matplotlib.pyplot as plt This is just an abbreviation to save typing matplotlib.pyplot in front of every reference to the module names. > import numpy as np as above > import numpy as * again an error.
Anyways, I would recommend reading on the structure of python here http://docs.python.org/contents.html which is what I plan on doing.
On to the plot.
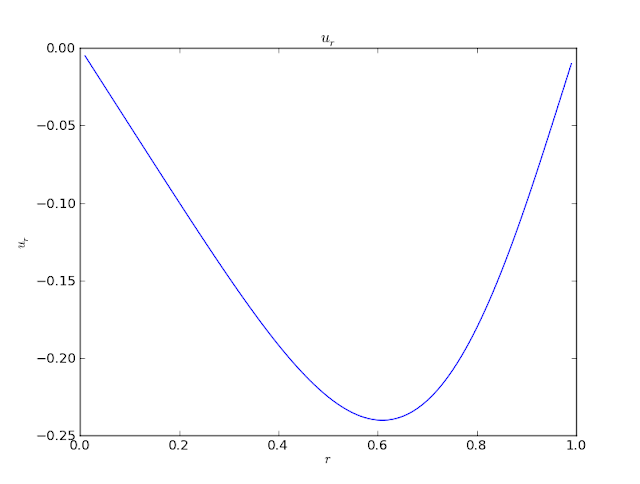
The code:
from pylab import *

r=arange(0,1,0.01)

z=arange(0,1,0.01)

sigma=1

l=1

kappa=1/(2*pi*sigma*l)

u=-(kappa/r)*sin(pi*pow(r, 2))

plot(r,u)

ylabel('$ u_r $')

xlabel('$ r $')

title('$ u_r $')

show()
The figure:

Screenshot of Spyder IDE:

History of Ubuntu: Revisited & Updated | Tech Drive-in
History of Ubuntu: Revisited & Updated | Tech Drive-in
Amen brother!! Ubuntu has done the exact same for me as you state in your opening. I began with 8.04 but did not really get into it until I became fed up with Windows and non-free software. I wanted an alternative and since 10.04 I haven't looked back!!!!
Amen brother!! Ubuntu has done the exact same for me as you state in your opening. I began with 8.04 but did not really get into it until I became fed up with Windows and non-free software. I wanted an alternative and since 10.04 I haven't looked back!!!!
Monday, April 16, 2012
Contour plotting (2D) - Sage - Streamlines
So, I am getting more familiar with other scientific software to use for my research. One I've been trying is Sage, and I've made a few post about it. I like it so far. Here is an example of a contour plot I've done recently for some streamlines and some effects.
http://www.sagemath.org/doc/reference/sage/plot/contour_plot.html


http://www.sagemath.org/doc/reference/sage/plot/contour_plot.html
kap_pa = 0.00621
r,z = var('r,z')
psee1 = kap_pa*z*sin(pi*r^2)
contour_plot(psee1, (r, 0, 1), (z, 0, 1), contours = 20, fill=False, axes_labels=['r','z'], aspect_ratio=1)

kap_pa = 0.00621
r,z = var('r,z')
psee1 = kap_pa*z*sin(pi*r^2)
contour_plot(psee1, (r, 0, 1), (z, 0, 2), contours = 20, fill=False, axes_labels=['r','z'], aspect_ratio=2)

kap_pa = 0.00621
r,z = var('r,z')
psee1 = kap_pa*z*sin(pi*r^2)
contour_plot(psee1, (r, 0, 1), (z, 0, 1), contours = 20, fill=True, axes_labels=['r','z'])

kap_pa = 0.00621
r,z = var('r,z')
psee1 = kap_pa*z*sin(pi*r^2)
contour_plot(psee1, (r, 0, 1), (z, 0, 2), contours = 20, fill=True, axes_labels=['r','z'], aspect_ratio=2)

kap_pa = 0.00311
r,z = var('r,z')
psee1 = kap_pa*z*sin(pi*r^2)
contour_plot(psee1, (r, 0, 1), (z, 0, 2), contours = 20, fill=True, axes_labels=['r','z'], aspect_ratio=2)

kap_pa = 0.00311
r,z = var('r,z')
psee1 = kap_pa*z*sin(pi*r^2)
contour_plot(psee1, (r, 0, 1), (z, 0, 1), contours = 20, fill=False, linestyles='dashdot', axes_labels=['r','z'])

kap_pa = 0.00621
r,z = var('r,z')
psee1 = kap_pa*z*sin(pi*r^2)
contour_plot(psee1, (r, 0, 1), (z, 0, 1), contours = 20, fill=False, linewidths=[1,5], linestyles=['solid','dashed'], axes_labels=['r','z'])

kap_pa = 0.00621
r,z = var('r,z')
psee1 = kap_pa*z*sin(pi*r^2)
contour_plot(psee1, (r, 0, 1), (z, 0, 1), contours = 20, cmap='hsv', axes_labels=['r','z'])

kap_pa = 0.00621
r,z = var('r,z')
psee1 = kap_pa*z*sin(pi*r^2)
contour_plot(psee1, (r, 0, 1), (z, 0, 1), contours = 20, cmap=[(1,0,0), (0,1,0), (0,0,1)], axes_labels=['r','z'])

kap_pa = 0.00621
r,z = var('r,z')
psee1 = kap_pa*z*sin(pi*r^2)
contour_plot(psee1, (r, 0, 1), (z, 0, 1), contours = 20, cmap='hsv', labels=True, axes_labels=['r','z'])

kap_pa = 0.00621
r,z = var('r,z')
psee1 = kap_pa*z*sin(pi*r^2)
contour_plot(psee1, (r, 0, 1), (z, 0, 1), contours = 20, cmap='hsv', labels=True, label_fmt="%1.4f", label_colors='black', axes_labels=['r','z'])

kap_pa = 0.00621
r,z = var('r,z')
psee1 = kap_pa*z*sin(pi*r^2)
contour_plot(psee1, (r, 0, 1), (z, 0, 1), contours = 20, cmap='hsv', labels=True, label_fmt="%1.4f", label_colors='black', label_fontsize=14, axes_labels=['r','z'])

kap_pa = 0.00621
r,z = var('r,z')
psee1 = kap_pa*z*sin(pi*r^2)
contour_plot(psee1, (r, 0, 1), (z, 0, 1), contours = 20, cmap='hsv', colorbar=True, labels=True, label_fmt="%1.4f", label_colors='black', label_fontsize=10, axes_labels=['r','z'])

Friday, April 13, 2012


Monday, April 9, 2012
Ubuntu 12.04 Beta 2 Released, Changes and Screenshots ~ Ubuntu Vibes | Daily Ubuntu Linux Updates
Ubuntu 12.04 Beta 2 Released, Changes and Screenshots ~ Ubuntu Vibes | Daily Ubuntu Linux Updates
Meant to post this awhile back, but I've been busy. The official release of 12.04 is almost here anyways. April 29th!
Meant to post this awhile back, but I've been busy. The official release of 12.04 is almost here anyways. April 29th!
Adobe flash plugin not working on any web browser - Ubuntu 11.10 - fixed
Guess what? Flash sucks, especially with Ubuntu, but until HTML5 takes over we are stuck with flash. For some unknown reason flash began NOT to WORK at ALL on my Ubuntu 11.10 machines (plural!). I tried everything! Finally, I got one machine to work by installing the sevenmachines PPA or so I thought. Apparently the sevenmachines PPA just went obsolete.
Anyways, my final fix:
1. Saw (in USC of all places!) where Gnash is supposedly conflicting with the flashplugin-installer, so I removed it.
2. I then typed flashplugin-installer into the USC and installed or made sure it was installed.
Not sure if this is the actual fix or if I got a combination by luck. I also have NO idea why this works or why the flash began to mess up in the first place. I think it may have begun with an Ubuntu update. Anyways, good luck, hope this helps someone.
Subscribe to:
Posts (Atom)